Billing and Usage Monitoring
Applicable role: Admin user Last updated: 2026-08-06
The dashboard is used for viewing organization usage trends. Usage records are used for querying individual calls and cost details. Cost reconciliation should be based on usage records within a specific time range.
Dashboard
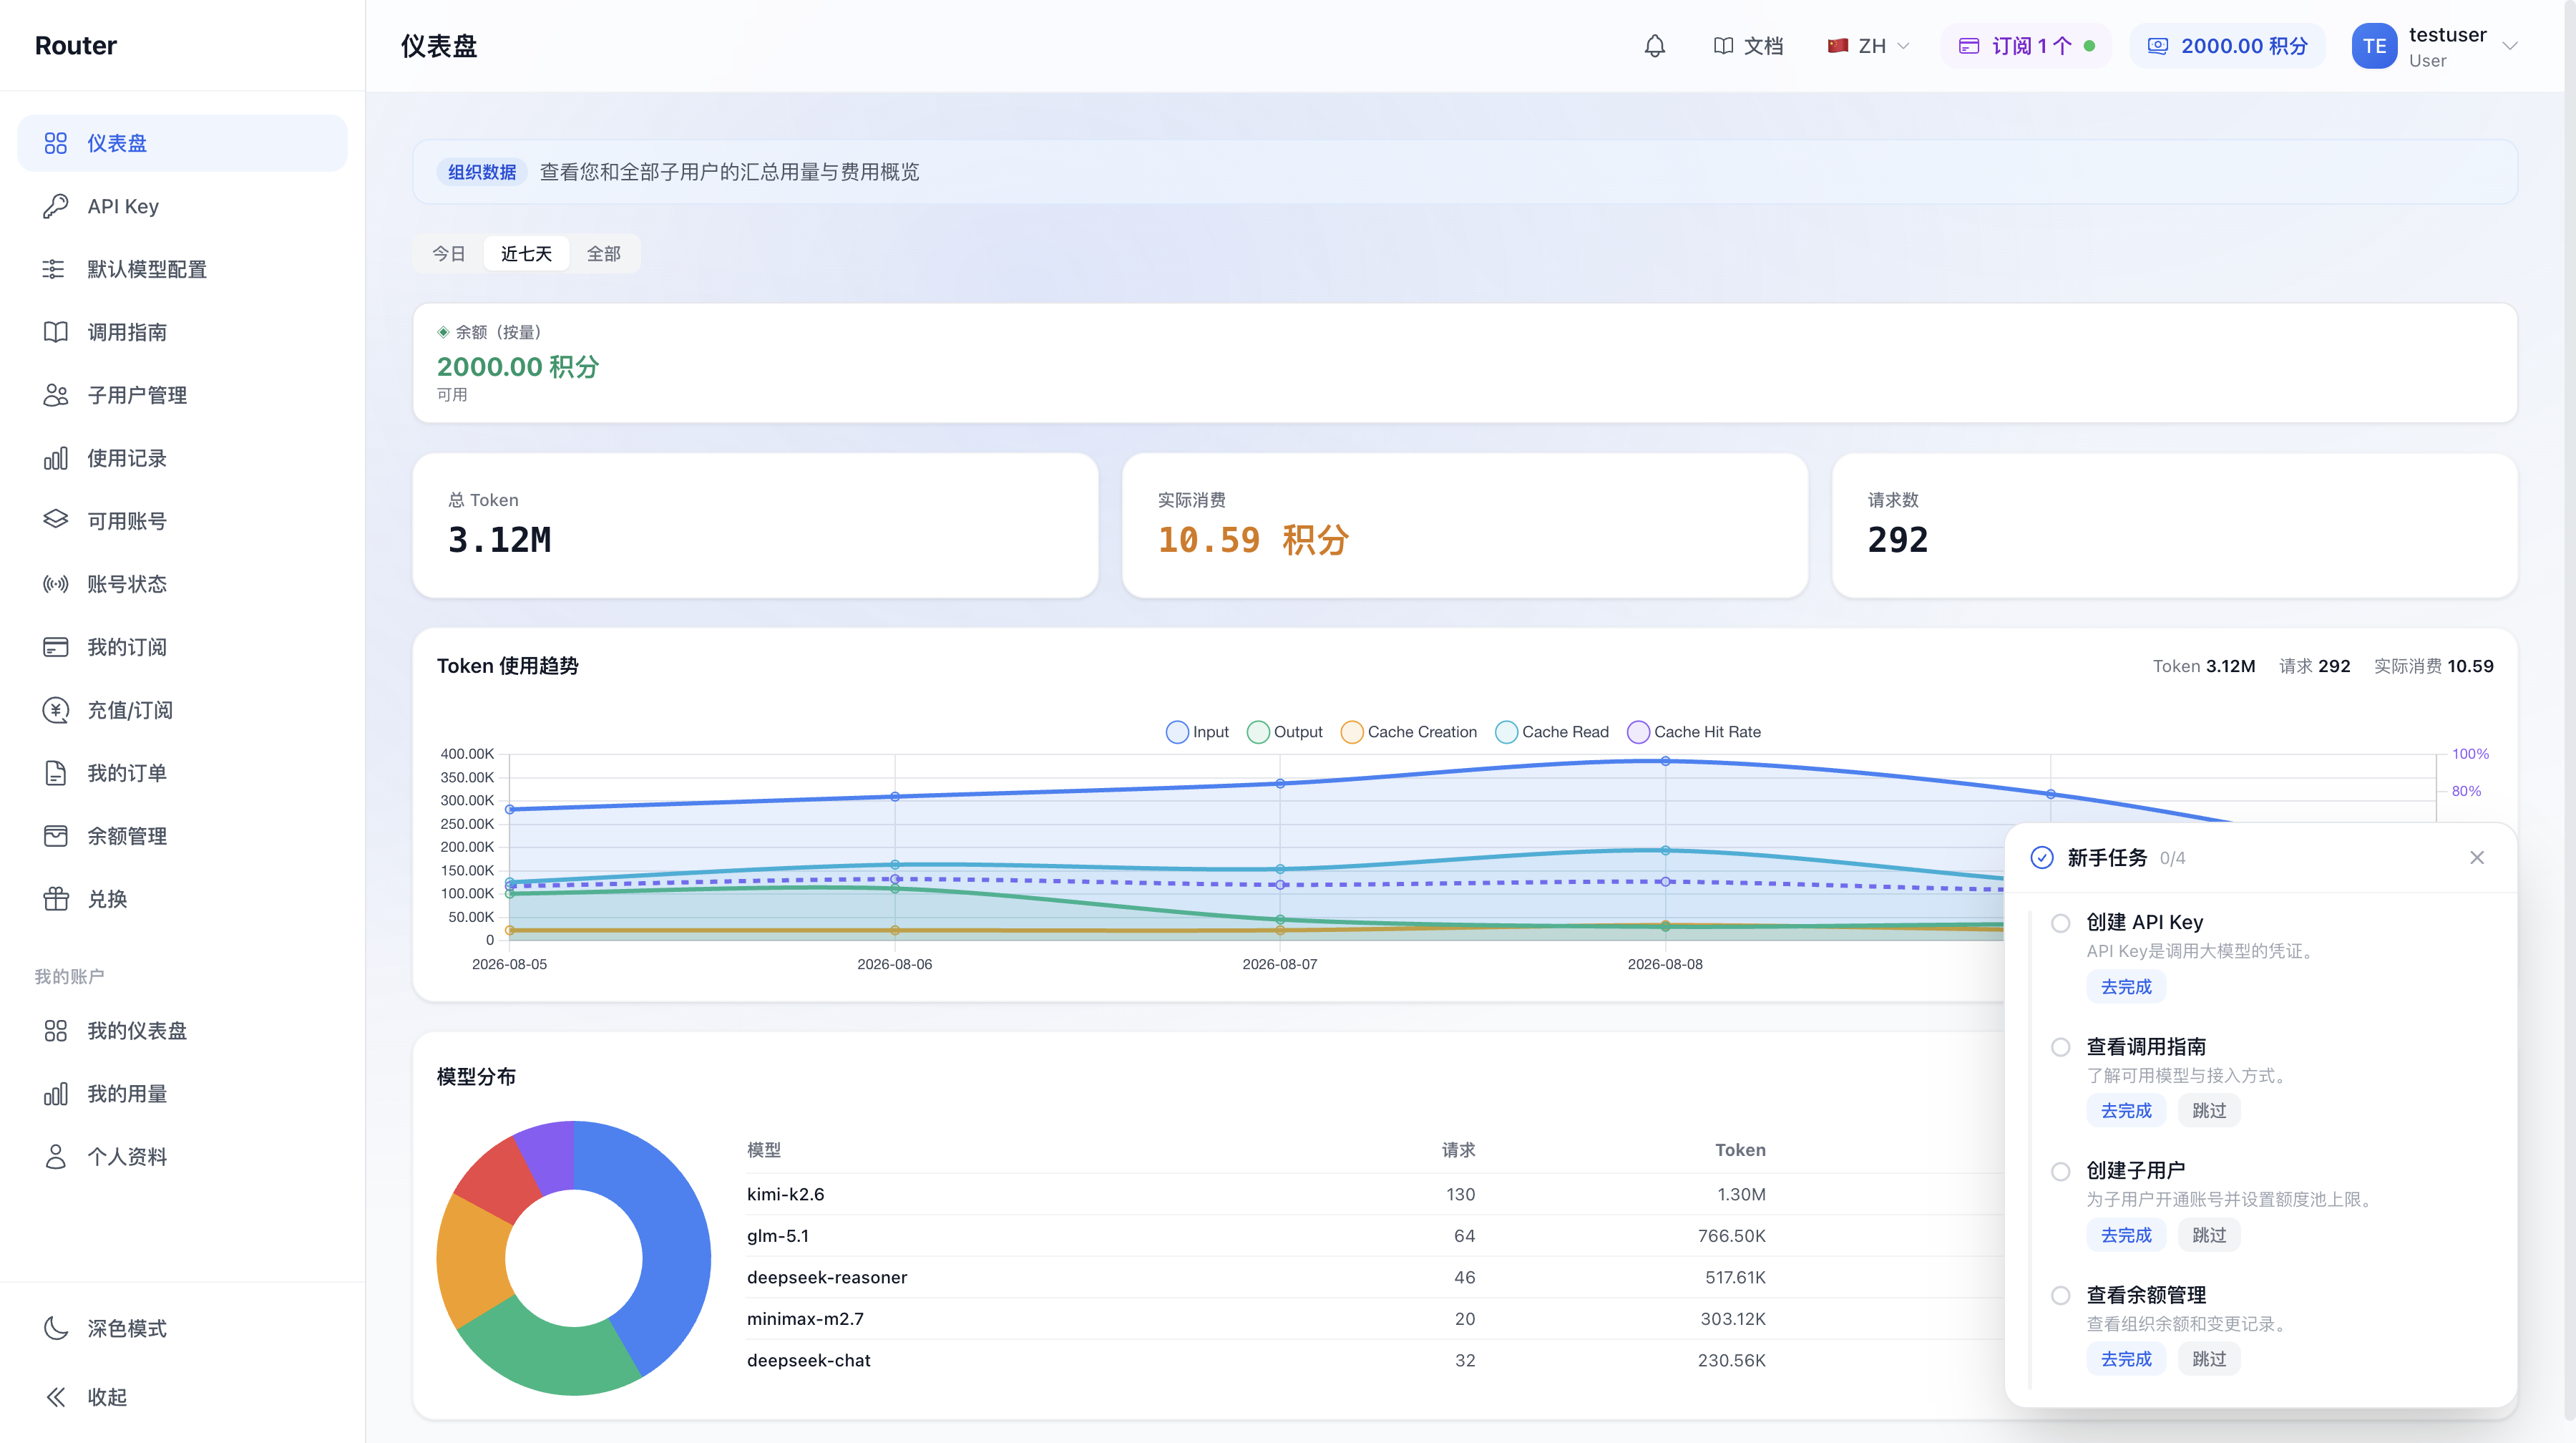
The dashboard typically includes:
| Area | Description |
|---|---|
| Organization Balance | Credits currently available for pay-as-you-go calls |
| API Key | Key count and enabled status |
| Requests, Spending, and Tokens | Today's or cumulative metrics |
| Performance Metrics | Response time and other service data |
| Model Distribution | Usage breakdown by model |
| Platform Breakdown | Usage breakdown by platform dimension |
| Usage Trends | Changes displayed for the selected time range |
| Recent Usage | Recent usage records |
The top statistics cards and the charts below may use different reporting periods. When comparing data, first confirm that the same time range is selected for both.
Usage Records
Open "Usage Records" and select a time range. Admin users can enable "Include Members" and filter by member, API Key, model, group, API endpoint, and billing type.
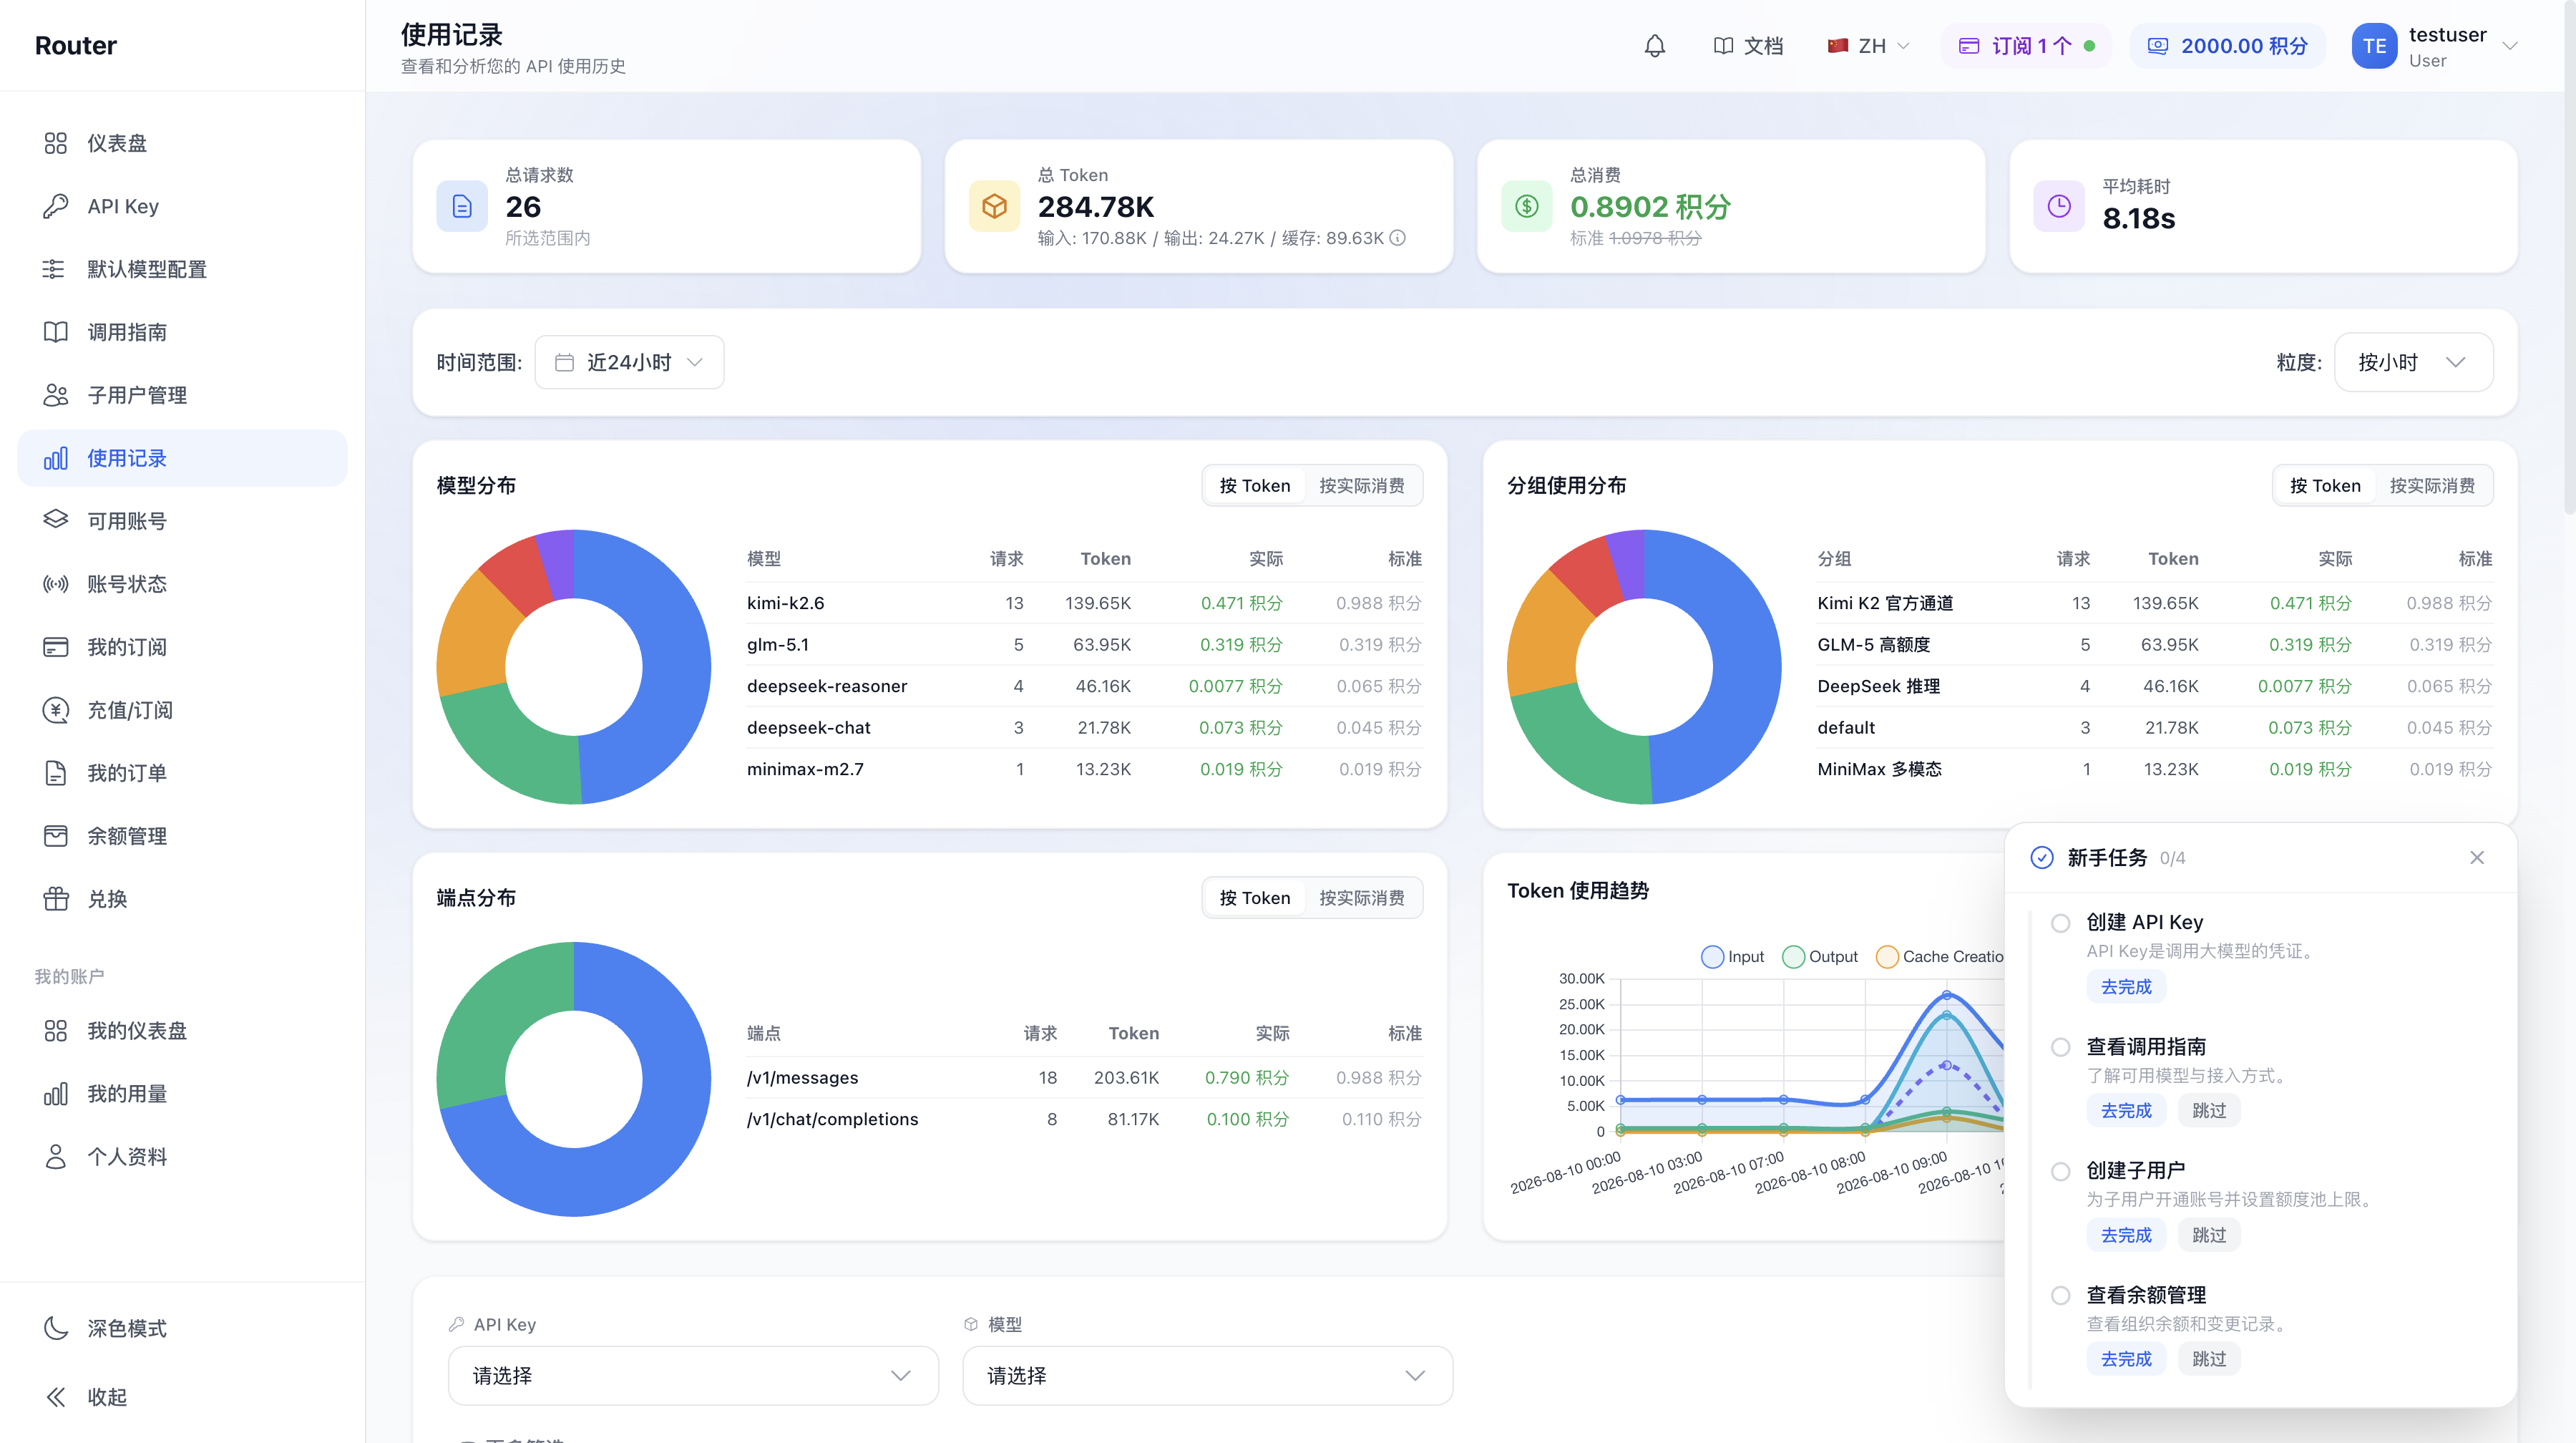
Common fields include:
- Request time and calling user;
- API Key and model call name;
- Actual group and routing source;
- Input, output, and cached tokens;
- Request status and response latency;
- Actual cost and billing type.
For further analysis, export the filtered data as CSV. The exported file may contain user, IP, and business identifiers; remove unnecessary fields before sharing externally.
Common Analysis Methods
Department or Member Costs
Select the billing period, include members, and export or summarize spending by member. When members change, maintain the mapping between accounts and cost centers.
Abnormal Usage
When a sudden increase in requests or spending is detected:
- Narrow the time range.
- Filter by member and API Key.
- Check the model, source IP, and request status.
- Determine whether it is a scheduled task, retry loop, or Key leak.
- If necessary, disable the Key first, then investigate application logs.
Route Verification
When the actual group does not match expectations, check the routing source, then verify the Key's bound group, default model config, and whether model includes a group identifier.
Data Consistency
The dashboard is suitable for observing trends; usage records are suitable for per-transaction reconciliation. Some aggregated metrics may update slightly later than call details. If significant discrepancies remain within the same time range, export the details and contact the platform for verification.
After deleting a member, historical usage is still included in organization statistics but may no longer be displayed individually by that member. Export personal details before deletion if you need to retain them.
FAQ
Can the admin user view member usage? Yes. Enable "Include Members" in usage records and filter by member.
Why are dashboard and usage record numbers different? First check the reporting period and filter conditions. The dashboard may use cumulative or aggregated data; for per-transaction reconciliation, usage records are authoritative.
What if there is a data update delay? Wait a moment and refresh. If the latest request still does not appear, confirm whether the request successfully reached the platform and record the request time and Key for troubleshooting.